

OSS Watch Survey 2006: Report
by Ellen Helsper on 15 July 2006
Introduction
OSS Watch is pleased to announce that it has recently concluded its 2006 survey of UK Higher Education and Further Education institutions.
During October 2003, OSS Watch conducted a study of UK Higher Education (HE) and Further Education (FE) institutions, looking at their attitudes and policies towards open source software (OSS). The purpose of the study was to influence OSS Watch’s plan for 2004 and 2005, and to provide a sound basis for understanding and addressing the needs of educational stakeholders in their use of open source software.
The main part of the 2003 study was a survey which investigated the current state of participation in free and open source software both in terms of projects developing such software and institutional deployment of such software.
When the 2003 study was conceived, it was envisaged that, if OSS Watch were to continue beyond pilot status, this survey would need to be repeated in 2006 in order to measure the growth of open source software in UK HE and FE institutions.
Executive summary
Introduction
OSS Watch is a JISC advisory service that provides unbiased advice and guidance about free and open source software for UK higher and further education. It was created in 2003, and one of its first tasks (in October 2003) was to conduct a study of UK Higher Education (HE) and Further Education (FE) institutions, looking at their attitudes and policies towards open source software (OSS). The purpose of this work was to influence OSS Watch’s plan for 2004 and 2005, and to provide a sound basis for understanding and addressing the needs of educational stakeholders in their use of open source software.
The main part of the 2003 study was a survey of ICT managers within HE and FE institutions. The survey investigated the current state of participation in free and open source software both in terms of projects developing such software and institutional deployment of such software1.
When the 2003 study was conceived it was envisaged that if the OSS Watch pilot service were to continue beyond pilot status then the survey would need to be repeated in 2006 in order to measure the growth of open source software in UK institutions.
OSS Watch is pleased to announce that it has recently concluded its 2006 survey.
This report gives details of the findings of the 2006 survey and compares the results wherever possible with those of the 2003 survey. The following three goals were identified as the most important for the 2006 survey:
to produce an up-to-date picture of the deployment of OSS in HEs and FEs
to draw comparisons with the results of the previous survey
to scope areas for future work by OSS Watch
Methodology
In the 2003 survey there was some confusion regarding who in the institution should complete the survey. For the 2006 survey, only ICT managers were asked to complete the survey. It was made available on one of OSS Watch’s web pages.
Questionnaire
The questionnaire2 for the 2006 survey was partly derived from the questionnaire used for the 2003 survey and from a questionnaire constructed for the FLOSSWorld project3 which ran in parallel to but was independent of this survey.
The questionnaire consisted of 45 questions organised into five topics:
1) Characteristics of the institution and the respondent
2) ICT policy regarding software and its deployment
3) Skills and awareness of ICT personnel in relation to software
4) Deployment of software on servers
5) Deployment of software on desktops
Response rate
One of the problems with the 2003 survey was its low response rate: of the 672 institutions contacted, only 63 replied. Of these 63 respondents, 22 answered for their department and only 41 answered for the whole institution (HE n=14; FE n=27). This is a response rate of 6%, which is very low.
It was important to improve the response rate for this survey since the suspicion was that only those institutions in which there was a higher interest in OSS would have replied, skewing the results. For the 2006 survey a list was composed containing the names of the individuals most likely to be in charge of ICT at each institution. These individuals, covering 637 institutions, were contacted in the first round by post. This letter contained the URL of the web page containing the questionnaire. The letter was followed up by an email that was sent to two mailing lists. The respondents were asked to answer the questions on behalf of the whole institution and not just for the department they worked in. Further emails were sent two and three weeks later. This time individual messages were sent to those people who had not yet completed the survey.
This exercise resulted in an improved response rate of 18% (114 institutions), three times higher than the response rate in 2003. This is thought to have improved the validity of the conclusions compared with the 2003 survey.
The response to the survey and interest in it was encouraging. The number of respondents who were willing to be contacted for a follow up survey (based on Q43) was high for this type of survey: 41% of those institutions that completed the survey were willing to be contacted again and 78 out of the 103 (76%) who participated were interested in receiving the report.
The fieldwork for the 2006 survey was conducted during February and March 2006.
Findings
This section describes the results of the 2006 survey. Whenever possible, comparisons have been made with the results of the 2003 survey. However, caution has to be adopted in doing this since the roles and responsibilities of those who answered the 2003 survey are not equivalent (see Methodology).
Characteristics of the institution and the respondent
Characteristics of the institution
The average number of staff and students was calculated for those institutions that completed the entire survey.4 Since only the total number of students over all institutions was given in 2003, and the questions were formulated differently, it is not possible to directly compare the average number of students and staff between the surveys.
The findings of the 2006 survey showed that the differences between HEs and FEs in the average number of students (see table 1) is not significant, but that the difference in the average number of staff is. Only two FEs answered that they had postgraduate students, which may account for the difference between HEs and FEs not being significant, even though the actual size difference is quite large.
Characteristics of the respondent
As can be inferred from table 2, the most common responsibilities of those individuals who answered the survey are software procurement/purchasing, and the development or overseeing of institutional ICT policies. Fewer than half of the respondents had any of the technical skills that were inquired about in the survey.
The only significant difference between the respondents from HEs and those from FEs was the administrative responsibility of approving software developed in-house. It seems that, in general, the respondents in this survey had a mainly administrative role and were not so much involved in the technical side of ICT policies and development. In terms of technical skills these findings largely echo the responses to the 2003 survey. However, in terms of administrative responsibilities there seems to be a larger number of respondents responsible for policy and procurement (in 2003 only 22% were involved in licensing agreements and 79% in procurement). This is probably because this time the survey was aimed at, and reached, the ICT directors of institutions.
ICT Policy regarding software and its deployment
ICT policy
Two questions were asked in relation to policy; first if the institution had an ICT policy and second if any policy in the institution mentioned software.
As table 3 indicates, 93% of the institutions have a stated ICT policy and 80% have a policy (not necessarily ICT related) that mentions software. Of those institutions that indicate that a policy (ICT or other) mentions software, the majority (80%) say that this is an ICT policy and a minority (20%) say that a different type of policy mentions software.
Figure 1 shows whether OSS is explicitly considered as an option in institutional policies, and whether its use is encouraged.
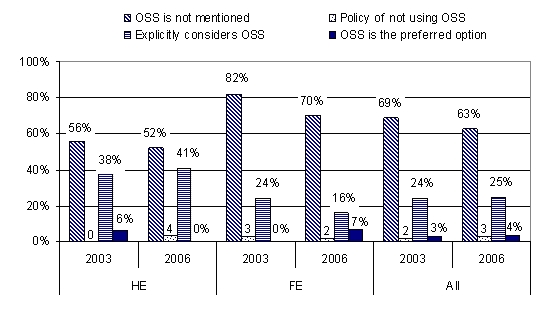
In 2006, for both types of institutions, it is most common that OSS is not mentioned at all (HE=52% and FE=70%). In 2003 there were no HEs that said they had a policy of not using OSS; in 2006 this figure has risen to 4%. Within FEs there was almost no difference between 2003 (3%) and 2006 (2%) in the percentage of institutions that have a policy of not using OSS.
In 2006, OSS is explicitly considered as an option more often in HEs (41%) than in FEs (16%). Some HEs indicated in 2003 that OSS was not only considered as an option but that it was also the preferred option (6%). This is no longer the case (0%), although the reverse happened for FE (0% in 2003, 7% in 2006).
Practice
However, policy might not always be a good reflection of what actually happens in practice, as is shown in figure 2.
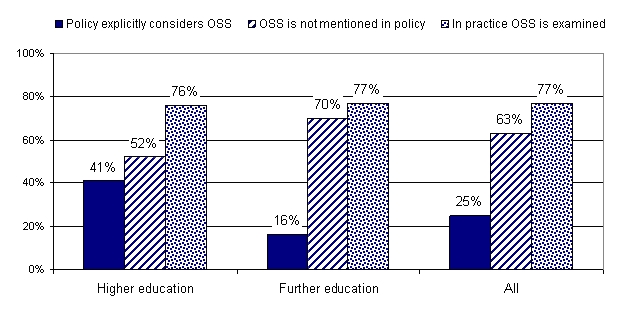
While in 2006 only 25% of policies in HEs and FEs explicitly mention OSS as an option and 63% of the policies do not mention it at all, in practice 77% of the institutions examine OSS as an option. This difference is particularly striking in FEs, where only 16% of policies consider OSS explicitly as an option but 77% examine it in practice.
In general a combination of OSS and proprietary software (PS) is preferred for an institution, as table 4 shows.
Skills and awareness of ICT personnel in relation to software
One indicator of the skill that staff have with regard to developing OSS is whether staff submit patches or other code to OSS projects.
Table 5 shows that the number of institutions in which staff submit patches is very small (N=11, 14%) and that often ICT managers do not know whether or not staff submit patches (N=15, 16%).
Table 6 indicates the knowledge (by ICT managers) of the regulations regarding the submission of patches or other code to OSS projects.
For those that do submit patches it is often a working practice rather than part of the person’s contract of employment. Again a considerable number of ICT managers (32%) are not aware how the submission of patches is regulated, even where they earlier indicated that they assumed staff do submit patches.
Table 7 indicates that frequently there are only a few members of staff that are aware of OSS.
Staff in HEs have a higher level of awareness than those in FEs. It seems that in general there are a few ‘experts’ within an institution, but the majority are not aware of (45%) or only have basic awareness of OSS (35%). The difference between HEs (3.61) and FEs (2.95) in terms of the level of awareness is statistically significant.
Table 8 shows that the same pattern (where HEs score higher than FEs) appears when looking at the level of experience in actually deploying OSS.
In both HEs and FEs there are very few staff with no experience and again, as was the case with awareness, it seems that in most institutions there are a few experts while the rest are unskilled (53%) or only have basic experience (36%).
The responses to Q16 and Q17 show that skill and awareness levels are not evenly distributed between ICT staff members in these institutions (see tables 7 and 8). Although the questions were phrased differently in 2003, there is enough similarity in the responses that the following conclusion can be drawn: while awareness levels were similar in 2003 and 2006, skill or experience levels are higher in 2006.
Deployment of OSS and Proprietary Software
In 2003 the questions relating to the deployment of OSS were phrased differently, and no distinction was made between the deployment of OSS on servers and desktops. In 2003, 86% of HEs and 72% of FEs deployed OSS. In the 2006 survey the deployment of OSS is without a doubt higher since all institutions indicated that OSS is deployed on desktops and a high percentage indicated that it is used on servers for a number of different applications.
In the 2006 survey, the use of OSS was examined separately for servers and desktops.
Deployment of software on servers
To understand whether there are intrinsic differences between HEs and FEs in terms of their deployment of OSS on servers, it is important first to understand whether there are differences in the number of servers that these institutions maintain.
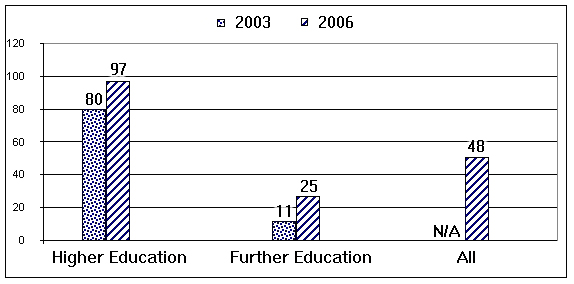
From figure 3 it is clear that HEs have a larger number of servers than FEs. In fact they have almost four times as many. Both in HEs and in FEs the number of servers has gone up from 2003.
Looking back at the difference in student numbers (10952 vs 5430), the difference between HEs and FEs may be accounted by the greater number of students (and thus users) at HEs. Indeed, there is a high correlation (r=.74, p<.01) and probably a strong relationship between the number of students and the number of servers. The relationship between the number of students and the number of servers is stronger in HEs (r=.87) than in FEs (r=.42).
Table 9 shows that most institutions (69%) have deployed, and will continue to deploy, OSS on their servers. There are very few who have tried OSS but do not wish to continue doing so (2%). Some have not used it in the past and will not do so in the future (18%), while another 11% have not used it in the past but intend to do so in the future.
Table 10 shows the future intentions of those who have used only PS on their servers in the past.
Of the 27 (29%) institutions that have not used OSS in the past, 10 (37%) intend to use it in the future. The proportion of HEs who have not previously used OSS but intend to do so in the future is marginally higher than the proportion of FEs (43% compared with 35%).
Those institutions that use OSS on their servers almost invariably use it in combination with proprietary components (see table 11). Only 3% of FEs (2 institutions) say they only use OSS. Even where institutions used OSS in the past but do not intend to do so in the future (see table 10) it is likely that the OSS that was used in the past is still running on these servers and will continue to do so: whilst these institutions do not intend to add more OSS in the future they have not removed the OSS that they have already deployed.
Use of OSS for specific applications on servers
Table 12 shows that, on servers, the use of OSS is most common for database servers, followed by web servers and operating systems. The least common use is for mail software and Virtual Learning Environments (VLEs). In general, PS is used more frequently than OSS with the exception of VLEs in FEs.
These findings are displayed visually in figure 4.
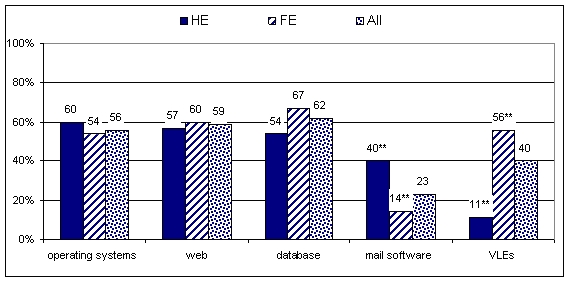
The difference between HEs and FEs is significant with regards to the use of open source mail software, which HEs use more commonly than FEs. In the case of VLE software this is reversed, FEs using OSS VLEs significantly more than HEs. This is particularly important given that HEs are generally more likely to use OSS than FEs. It is one of the few instances in which FEs are more likely to prefer an OSS alternative.
Figure 5 shows that the use of proprietary software on servers is widespread across most applications. As has already been mentioned, it is only in VLEs that OSS can claim an overall lead over proprietary alternatives. Figure 5 also shows that FEs tend to rely more on proprietary operating systems than HEs.
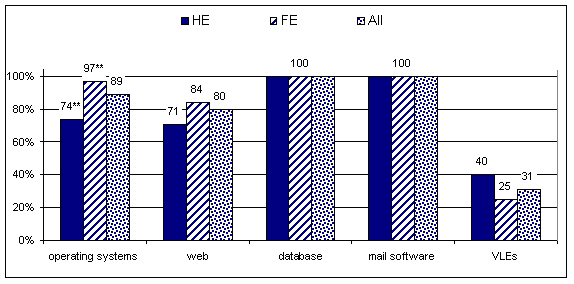
Table 13 indicates the software that is most often used for each application. It also indicates whether on the whole OSS, PS or OSS and PS is used for this application.
For questions Q21 to Q25 there were almost no applications for which only OSS was used; the exceptions were web server software and VLEs. For all other applications both OSS and PS were used by the same institution.
There was a significant difference between HEs and FEs with regard to the operating systems used on servers. Solaris was mentioned significantly more by HEs than FEs. Also, as has already been mentioned, FEs are more likely than HEs to use Microsoft Windows.
In HEs, use of OSS (Sendmail and/or Exim) for mail software (40%) is similar to the usage of Microsoft Exchange (43%), whereas in FEs open source mail software is not used much in comparison to Microsoft Exchange (10% against 67%).
An unexpected finding was that Microsoft IIS is mentioned extensively for web servers (80%), whilst internationally the Apache web server dominates5 . Similarly surprising is that Apache Tomcat is used to the same extent (54%) as the Apache web server (51%) in HEs, although in FEs the more common pattern appears, in which the Apache web server (57%) is used more than Tomcat (32%).
There are fewer institutions that use OSS for databases (62% use MySQL and/or PostgreSQL) than use Microsoft SQL Server (80%). This difference is larger for FEs (difference=20%) than for HEs (difference=12%).
The overall difference in the use of OSS between HEs and FEs for VLE applications (see table 12), can be attributed to the Moodle VLE being used far more frequently in FEs than in HEs.
For a number of applications, it was not clear (when designing the survey) which software would be most commonly used. Therefore an open-ended question (see figure 6 and table 14) was used, allowing respondents to indicate which piece(s) of software they used. Most mentioned only one OSS or PS application, and there were no instances in which both OSS and PS were used within the same institution for the same application.
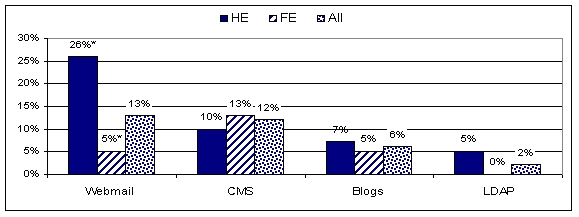
For this question, all the responses for Wiki software were OSS, whereas only PS were named for calendar/diary server software.
HEs are more likely than FEs to use OSS for webmail (26% vs 5%). For all other types of applications, the differences between the use of OSS in HEs and FEs are not significant. LDAP, blogs and calendar servers are the applications for which OSS is least frequently used.
Table 14 also shows that there is no commonly accepted software for Content Management Systems (CMS). Indeed, the range of software being used for a CMS is wider than for other applications. In all, 69 institutions answered the question about CMS, and they gave 29 different answers. The most used CMS was Microsoft’s, but even this was used in only 8% (i.e., 6) of those institutions that answered this question. Whilst FEs mention that they use Moodle as a CMS, it is not mentioned by HEs at all, reflecting the same practice as with VLEs.
Wikis and blogs may be much hyped in the press, but of the 23 institutions (23%) that answered the question about wikis, 48% said their institution did not use them, and of the 22 that answered the question about blogs, 55% indicated that they did not use such software. It can perhaps be assumed that those who gave no answer to these questions also did not use these applications, which would increase these percentages.
Reasons for using or excluding software on servers
Respondents were asked to give their reasons for using PS and OSS, and for excluding OSS from servers. Table 15 reveals the reasons given for using proprietary software.
A wide range of reasons was given for the use of PS, and eight out of the nine reasons were indicated as playing a role in decision-making by more than half of the institutions. The most often mentioned reasons were expert support (87%) and performance (87%). The only reason that was mentioned by less than half of the respondents was that consultancy support already existed (48%). Low additional upgrade costs (51%) were also considered less relevant than the other reasons given. The conclusion is that there is no one reason, nor a simple combination of reasons, that determines the choice of proprietary software.
The respondents were also asked to indicate whether each of the suggested reasons was ‘not a reason’, ‘a reason’, or ‘an important reason’ in making the decision to choose PS, by scoring each option from one to three (see table 16).
The reasons, ranked according to importance, order themselves in the same way as was observed in table 15 (where they were ranked more simply according to whether they constituted a reason or not). Expert support and performance were not only mentioned by most institutions; they were also the most important reason for choosing this type of software. Comments made in the “other” category for this question related to there being a requirement in the industry to use the same software that is used in the ‘outside’ world.
Those respondents who said that their institution used OSS were also asked to indicate the reasons for using this type of software. The results are given in table 17.
The responses indicate that the decision to use OSS is mainly based on the total costs of ownership (74%), followed by avoiding the problem of being locked in (63%), and better operability with other products (59%). Given that five of the nine reasons were infrequently mentioned (i.e., by less than half of the institutions), the reasons for using OSS are more specific and concentrated than those for choosing PS.
Table 18 shows, that, when ranking these reasons according to importance, the difference between HEs and FEs becomes clear. The prevention of ‘getting locked in’ is more important to FEs (average=2.1) than HEs (average=1.5). All other reasons are equally important in both types of institutions.
Ideology and the need for a better response were the least important and the least mentioned. In fact one respondent felt quite strongly about the ‘misuse’ of ideological reasons for selecting software. This person added a specific comment that argued that ideology would be the poorest basis on which to decide which software to use, and that functionality and costs should be the only reasons that count. A few other comments indicated that OSS was used for teaching purposes although it was not necessarily used for any of the other reasons. Another respondent added that there were good experiences in the sector with adopting OSS and that there was better security with OSS.
The last set of questions related to the reasons for excluding OSS (see table 19). No similar question was asked for PS since no institution had explicitly indicated excluding PS.
In a similar vein to the comments about the reasons for using PS, one of the most frequently mentioned reasons to exclude OSS was the perceived need for extra staff training (79%). User expectations (68%) and third party support (65%) followed closely. There was a wider variety of reasons mentioned for excluding OSS than for choosing it, and 8 of the 10 reasons were mentioned by more than half of the institutions. Legal issues (22%) or the lack of enthusiasm of staff (33%) were not frequently mentioned as reasons for excluding OSS. Fears seem to be more related to costs and lack of experience.
Respondents were once again asked to indicate how important these issues were. The responses are indicated in table 20.
The need for third party support was more important in HEs (av=2.3) than in FEs (av=1.8). In fact, in HEs third party support (av=2.3) and meeting user expectations (av=2.3) were more important than perceived training needs.
In the comments to these questions, the lower importance of reasons indicating a lack of enthusiasm, such as ‘nobody wanted it’, was confirmed by those institutions who indicated that there was no decision made to actively exclude OSS. Most additional comments to this question were related to a lack of experience of staff, as one respondent put it, “outside the university sector” (i.e. outside HEs).
Institutional support for the use of OSS
This lack of experience is clearly an issue since, as table 21 shows, most of the institutions that use OSS on their servers rely on in-house support for OSS.
In comparison to developing OSS (i.e., submitting patches, see table 5), where the ICT manager was often not aware of what was going on in practice, the support of OSS is more regulated. In HEs support of OSS is part of the job specification of some individuals (64%), whilst in FEs it is more often an informal arrangement (53%) because individuals do it even when it is not in their job specification.
Deployment of software on desktops
A similar set of questions as the ones asked for servers was also asked for the use of software on desktops.
As was the case with servers, HEs have significantly more resources in terms of desktops than FEs (see table 22). Again, this appears to be related to the number of students that institutions have (r=.81, p<.01). As before, this relationship is stronger for HEs (r=.90) than for FEs (r=.82) but the difference between these two types of institutions is less clear than for servers. However, the percentage of desktops that are managed directly by ICT is smaller in HEs (58%) than in FEs (100%).
Figure 7 shows that a large majority of managed desktops run Windows (95%). There is greater use of Windows on desktops in FEs (97%) than in HEs (91%), and greater use of Macs in HEs (14% vs 5%).
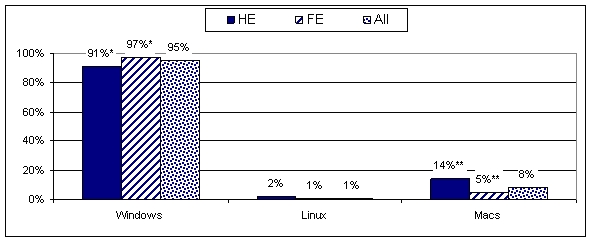
Table 23 shows that there is more flexibility in HEs than in FEs as, in the latter, the users have less choice regarding the applications that they can run on their desktops.
The differences between the two types of institutions in the way applications on desktops are managed are significant. Looking across the institutions it appears that changing the application set is often not possible (62%). In reality this is the case only within FEs (77%) and not within HEs (30%) where users can change the application set after approval of ICT services (57%).
Institutions were also asked about the applications they deployed on their desktops. The responses are summarised in table 24.
In contrast to servers, the use of OSS on desktops is far less common, both in the past and as predicted for the future. Almost half of the institutions (47%) indicated that they have not used OSS in the past and will not use it in the future. There have been very few bad experiences with OSS, as is evident from the number of responses by those that have used it in the past who are also likely to do so in the future (35% of the total as opposed to the 1% that plans to cease using OSS). Again, there are a fair number of institutions that show a future willingness to deploy OSS without having had the experience of using it in the past (16%). The differences between HEs and FEs in their history of OSS deployment on desktops is not significant.
Figure 8 shows the proportion of institutions deploying only PS, only OSS, and a mixture of PS and OSS on their desktops.
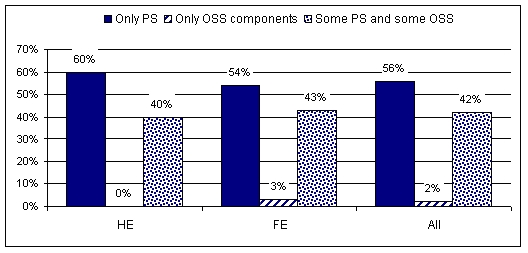
Marginally more than half of the institutions (56%) use only PS on their desktops, and it is as uncommon for institutions to use only OSS (2%) on their desktops as it is for them to use only OSS on servers (2%). Amongst HE respondents, there is not one who uses only OSS on its desktops. It is far less common to use both PS and OSS on desktops (42%) than it is on servers (75%). PS thus dominates desktop applications much more than it does server applications.
Use of software for specific applications on desktops
A list of operating systems was provided in the survey, and respondents were asked to indicate whether they were used on desktops.
Table 25 shows that the operating systems installed on desktops were mainly Windows and MacOS. The main difference between HEs and FEs was in their use of Solaris, which is only used in HEs (11%).
The use of open source operating systems is not common in either type of institution, but is more common in HEs (Linux 17%). In HEs, Linux appears to have been used to about the same extent in 2003 (76%) as it was in 2006 (60% on servers and 17% on desktops). In FEs, its use seems to have been slightly less in 2003 (56%) than in 2006 (54% on servers and an additional 8% on desktops). However, since in the 2003 survey servers and desktops were grouped together, it is difficult to draw conclusions about whether this is a trend or just caused by a different way of asking the question.
Another part of the survey addressed the question of which software applications were deployed on the institution’s desktop.
Table 26 shows, that in 2006, Microsoft Office and Internet Explorer are used by all institutions on desktops. Other commonly used software products are Microsoft Outlook and the Mozilla/Firefox web browser. Netscape and Thunderbird are only deployed by about one fifth of the institutions. HEs use Matlab (non OSS, 33%) and LaTeX (OSS, 20%) significantly more than FEs (8% and 5% respectively). The reason for this might be that both programs are used specifically for academic publication and analyses.
OpenOffice, which seemed quite popular in 2003 amongst HEs, has dropped somewhat in popularity, from 38% to 23%, but remained about the same for FEs (23%). The use of Mozilla/Firefox (68%) is now considerably higher than in 2003, where on average 44% of the HEs deployed it and 32% of the FEs. Octave, which in 2003 was deployed only by HEs, is now used on desktops only by the FE respondents. The use of LaTeX in HEs has decreased since 2003, from 41% to 20%, but has stayed about the same in FEs.
Table 27 displays the findings of this part of the survey according to the extent of deployment, i.e., whether it is used on all desktops or only on some desktops.
The difference in extent of usage between HEs and FEs is significant for Office and Internet Explorer. It seems that in general FEs depend to a greater extent than HEs on PS (Microsoft) for their desktops.
Whilst 23% of both HEs and FEs have desktops installed with OpenOffice, only 3% of the FEs had it on all desktops (extent of use=1.26), whilst amongst HEs there were no institutions with OpenOffice installed on all desktops (extent of use=1.23). 87% of the HEs indicate that they use Microsoft Office on all desktops (extent of use=2.87), whereas 98% of the FEs (extent of use=2.98) say they have it on all desktops.
Reasons for using or excluding software on desktops
In contrast to the case with servers, there is no difference in the reasons given by HEs and FEs as to why they use PS or OSS on desktops, nor are there any significant differences as to why they might exclude OSS.
The same reasons are mentioned and considered important for using PS on desktops as were important on servers (see Tables 15, 16 and 28). That is, expert support and the performance of the software are mentioned most often (78% and 80% respectively) and are regarded as most important (2.13 and 2.12), whereas the lack of in-house expertise and consultancy support are least mentioned (48% and 35%) and regarded as least important (1.65 and 1.41). A range of reasons have high levels of importance and, again, there is no one reason that can be said to be the decisive factor in using PS.
Saving on total cost of ownership is, for desktops as for servers, the most important reason to use OSS on desktops (see Tables 17, 18 and 29). This was also indicated as the most important reason in the 2003 survey. Being locked in was not mentioned as an issue in 2003, but in 2006 the majority (73%) of the participating institutions indicated that they chose OSS for this reason either on their desktops or on their servers or on both. Ideology is not a particularly important factor (average importance=1.33) for respondents, although a third of them indicated that it does play a role (31%).
Table 30 shows that the reasons given for excluding OSS from desktops are also similar to those given for servers (see table 20).
Training needs ranks highest in the list of reasons to exclude OSS from both servers and desktops. Similarly, user expectations are as important for desktops as they are for servers. Again legal issues is the least important and the least mentioned reason to exclude OSS. However, a lack of enthusiasm by users is considered more important to the decision to exclude OSS from desktops (1.7) than it was for servers (1.5); only 33% mentioned this as a reason for servers, whereas 50% mentioned this as a reason for desktops. On the other hand, the absence of specialised OSS software was more important on servers (62% mentioned, average importance 1.9) than it was on desktops (44% mentioned, average importance 1.7).
Training needs and user expectations, the two most important reasons for excluding OSS, were not mentioned in the 2003 survey. So it seems that new issues have come to the fore over the last three years in relation to the training and expertise needed to run OSS. The need for third party support is considered to be far more important now than it was three years ago (37% mentioned this reason then as opposed to 59% now). This shift might indicate a change in perception as to how OSS is or should be managed: a shift from assuming that software management can or should be run from outside the institution to the perception that this needs to be done through a combination of in-house expertise and external support or training. Interoperability was an issue in 2003, and is still an issue for desktops, although not so much for servers in this survey.
Conclusions
In comparing this survey with that conducted in 2003, a generally positive picture of the use of Open Source Software (OSS) in institutions emerges. Not only is OSS used more often for more applications than in 2003, but there are also higher levels of skill and experience within institutions. A reasonable number of institutions that have not used OSS before intend to do so in the future. However, it is unlikely that OSS will come to dominate the market in the foreseeable future. Proprietary software (PS) is still used more extensively, especially in FEs, and OSS is almost invariably used in combination with PS.
Even in the 2003 survey it was clear that making the distinction between HEs and FEs is important, perhaps even more than the size of the institutions. Overall, the picture both for servers and for desktops is that HEs are better equipped both in human and in material resources than FEs, even when one takes the size of the institution into consideration. However, it is logical that the resources available to certain institutions are related to the number of staff and students or users of the software. Larger institutions have more desktops and servers and more expertise independent of what type of institution they may be.
HEs also seem to have more expertise in the deployment of OSS. Different issues obviously play a role in decisions made in different types of institutions as to whether to use OSS or PS. There was one exception to the pattern of HEs making more use of OSS than FEs, and that was the relatively extensive use of Moodle in FEs. One can only speculate as to why proprietary VLEs are used more in HEs than in FEs. Maybe HEs were earlier adopters of VLEs and are now locked in, or maybe both HEs and FEs became partially locked in but HEs have the money to afford to still be locked in.
The analysis shows that besides the differences in size and type of institutions, the distinction between servers and desktops is an important one to retain in future studies. Software use is not uniform across different areas and it is important to make this distinction within institutions as well as the distinction between different types of institutions.
Although the use of OSS differs across different applications and between servers and desktops, the reasons for using or not using OSS follow a similar pattern. The institutions build on a broader range of reasons in the use of PS than they do for the use of OSS. Specific reasons, such as training needs or the fear that OSS will not meet user expectations, play an important role in deciding to exclude OSS and use PS. Those institutions that do make a choice to use OSS often do so to save costs or to avoid being locked in by PS companies.
In general, there seems to be a fear that using OSS will require human resources and skills that institutions do not have. However those institutions that do use OSS do not indicate that they do so because they have in-house skills, instead they are using OSS for economic reasons. This is an important finding, which could give hints in terms of how to help those institutions that would like to start using OSS. This group of institutions is probably more convinced by technical support arguments or offers for training in OSS than they will be by arguments that focus on the possibilities of saving money.
-
For more information about the OSS Watch 2003 Survey, see http://www.oss-watch.ac.uk/studies/scoping/ ↩
-
See appendix A for the full questionnaire. ↩
-
We are extremely grateful to members of the FLOSSWorld project consortium (http://www.flossworld.org/) for giving us access to their questions and for allowing the questions to be used in the questionnaire for OSS Watch Survey 2006. ↩
-
After controlling for missing data and erroneous completion of the 2006 survey, 91 UK institutions submitted surveys that could be fully analysed for the purposes of this survey. See appendix B for a full list of the questions and the number of responses to each question. ↩
-
For details of the Web Server Survey conducted each month by Netcraft, go to http://news.netcraft.com/ ↩